Method
Method
How Did I Conduct This Study?
To explore whether business students’ AI literacy influences their willingness to use AI at work, I designed a study that combines theoretical modeling with data-driven analysis.
I built an extended version of the Technology Acceptance Model (TAM) by adding two new components: Perceived Credibility and AI Literacy. Then, I created a customized survey for students at Emory University’s Goizueta Business School and gathered 98 valid responses across different majors and academic levels.
AI Literacy: Not Just for Techies Anymore
To analyze the data, I used three main tools: SPSS (for statistical analysis), AMOS (for path modeling and structural equation modeling), and the Bootstrap method (to test whether certain variables act as mediators)
Altogether, this approach helped me go beyond simply asking “Will students use AI?” — it allowed me to understand why they would or wouldn’t, and what factors truly influence that decision.
Technology Acceptance Model (TAM)
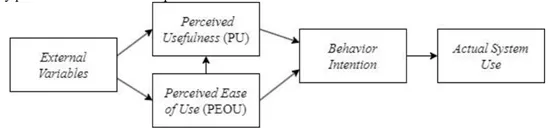
At the heart of my study is the Technology Acceptance Model (TAM) , a well-known framework used to predict people’s technology adoption behaviors.
It focuses on two key beliefs:
- Perceived Usefulness (PU): Does the technology help me do my work better?
- Perceived Ease of Use (PEOU): Is it easy to learn and use?
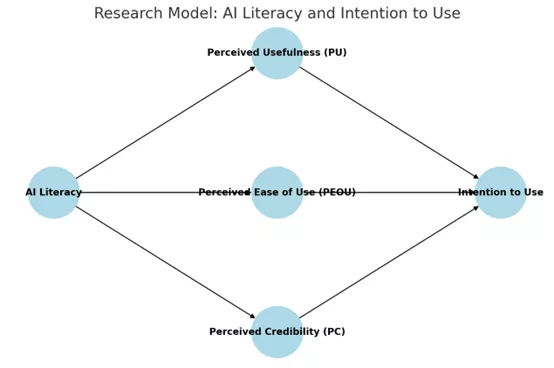
To tailor it to the world of AI, I extended the model in two ways:
- I added a third factor: Perceived Credibility essentially, do students trust what AI tells them?
- I introduced AI literacy as an external variable that influences the other three.
In short, my extended TAM model helped me examine how students’ understanding of AI shapes how useful, usable, and trustworthy they believe AI is — and how that influences their intention to use it at work.
SPSS: (Statistical Package for the Social Sciences)
Like an advanced version of Excel — but made for serious statistics.
SPSS stands for Statistical Package for the Social Sciences, and it’s one of the most widely used tools in academic and business research.
After I collected my survey responses, SPSS was the first tool I turned to. I used it to:
- Calculate averages and standard deviations;
- Check how consistent the survey items were (known as reliability testing);
- Explore simple relationships between variables (like AI literacy and perceived
usefulness).
In short, SPSS helped me understand what the students were saying and whether their responses formed clear patterns.
AMOS: (Analysis of Moment Structures)
The tool that draws connections and tests cause-effect pathways.
AMOS, which stands for Analysis of Moment Structures, is a tool designed for advanced modeling — especially when you want to test cause-and-effect relationships between variables.
In my research, I used AMOS to:
- Build a diagram showing how AI literacy, perceived usefulness, ease of use, and credibility all connect;
- Measure the strength and significance of each path in the model;
- Test how well my overall model fits the real-world data (a process called model fit evaluation).
AMOS essentially lets me take the “ideas” from my theoretical model and see if they actually hold up when tested with real student responses.
Bootstrap: Verifying the Middlemen
A resampling method that helps test if something really works as a “bridge” between two things.
Imagine you suspect that Perceived Usefulness explains why AI literacy leads to AI use intention. How do you confirm that it plays a “mediating role”? That’s where Bootstrap comes in.
Bootstrap:
- Resamples your dataset thousands of times (with replacement);
- Tests whether the indirect effect is statistically meaningful;
- Builds confidence intervals to determine whether those effects are reliable.
In simple terms, it’s like doing the experiment thousands of times to see if your “middle step” really matters — and it helped me prove that the bridges in my model weren’t just guesses.
What Kind of Survey Did I Use?
To gather data, I created a structured survey tailored for business students at Emory’s Goizueta Business School. The survey measured five key areas: AI literacy, perceived usefulness, ease of use, credibility, and intention to use AI — all based on established research models.
Each statement used a 5-point Likert scale, from “strongly disagree” to “strongly agree.” Example items included:
- “I can explain how AI works.”
- “I find AI tools helpful in completing tasks.”
- “I intend to use AI in my future career.”
In total, I collected 98 valid responses.
You can find the full list of survey questions in the appendix of my full thesis.